
![]()
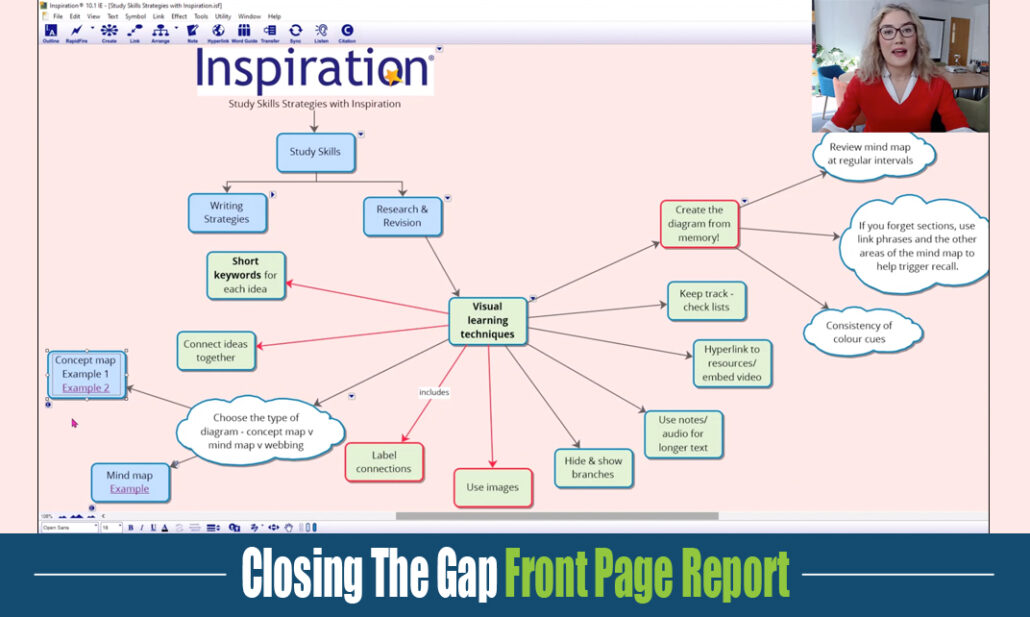
Introducing Inspiration 10 and Inspiration Maps software, simple but powerful visual thinking tools for creating concept maps, mind maps, diagrams, graphic organizers, outlines and presentations with ease!
Inspiration 10 and Inspiration Maps boost creativity, encourage critical thinking, and break down barriers to planning, communicating ideas and learning; helping users to achieve more academically and in the workplace.
Concept Mapping
Introduction to Concept Mapping
Used as an analysis, learning and teaching technique, a concept map visually illustrates the relationships between concepts and ideas.
Often represented in circles or boxes, concepts are linked by words and phrases that explain the connection between the ideas, helping users to organize and structure their thoughts, further understanding and discover new relationships. Concept mapping is popular in science, health education, engineering and more.
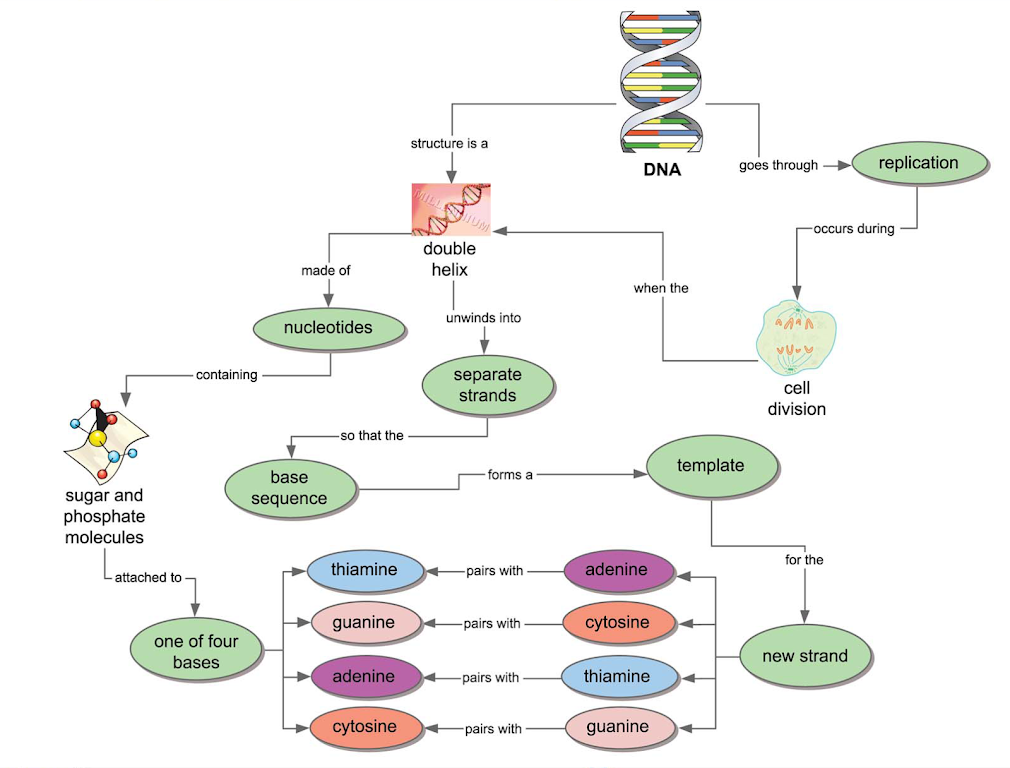
Concept map example – DNA
What is a Concept Map?
A concept map is a diagram that illustrates the relationships between concepts and ideas. Concept maps use linking phrases between concepts to explain connections. Concept map software like Inspiration 10 assists with the personalized design of concept maps with its flexible diagram view.
Benefits of Concept Mapping
The purpose of concept mapping is to:
- Allow users to clearly and confidently communicate ideas, thoughts and complex information
- Encourage users to discover new concepts and the relationships that connect them
- Help users brainstorm and generate new ideas
- Help users integrate new concepts with existing concepts
- Enable users to gain enhanced knowledge of any topic and evaluate the information
How to Create a Concept Map – 4-Step Guide
Concept maps are typically hierarchical, with the subordinate concepts stemming from the main concept or idea. However, digitally created concept maps always allow for change and new concepts to be added. Inspiration 10’s flexible diagram view allows concept positions on a map to continuously change, while always maintaining the same relationship with the other ideas on the concept map.
- Start with a main idea, topic, or issue to focus on – A helpful way to determine the context of your concept map is to choose a focus question—something that needs to be solved or a conclusion that needs to be reached. Once a topic or question is decided, that will help with the structure of the concept map.
- Then determine the key concepts – Find the key concepts that connect and relate to your main idea and rank them; most general, inclusive concepts come first, then link to smaller, more specific concepts.
- Connect concepts – Create links to connect concepts and demonstrate relationships. Once the basic links between the concepts are created, add cross-links, which connect concepts in different areas of the map, to further illustrate the relationships and strengthen understanding and knowledge on the topic.
- Label links – Add linking words or phrases that illustrate the relationship between concepts. It is ideal to be able to read your concept map like a sentence.
Find out more about how to create a concept map here.
Concept Maps in Education
Concept mapping is a powerful way for users to reach high levels of cognitive performance. A concept map is also not just a learning tool, but an ideal evaluation tool for educators measuring the growth of and assessing student learning. As a student creates a concept map, they reiterate ideas using their own words. Educators are then able to see what students do not understand, providing an accurate, objective way to evaluate concepts students do not yet fully grasp.
Mind Mapping
Introduction to Mind Mapping
Mind mapping is a visual form of note taking that offers an overview of a topic and surrounding information, allowing students to comprehend, create new ideas and build connections. Through the use of colors, images and words, mind mapping encourages students to begin with a central idea and expand outward to more in-depth sub-topics.
SWOT Analysis mind map created in Inspiration 10
SWOT Analysis mind map template in Inspiration 10
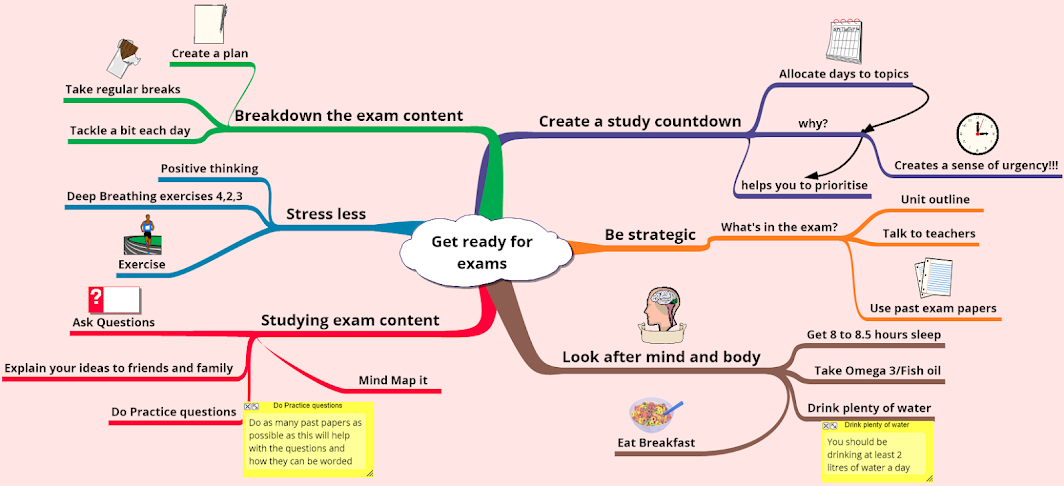
Example mind map on getting ready for exams, created in Inspiration 10
Definition of a Mind Map
A mind map is a visual representation of hierarchical information that starts with a single, central idea surrounded by connected branches of associated topics. Inspiration 10’s dedicated mind mapping environment makes it the perfect mind map software for creating efficient and personalized digital mind maps.
Benefits of Mind Maps
- Help users brainstorm and explore any idea, concept, or problem
- Facilitate better understanding of relationships and connections between ideas and concepts
- Make it easy to communicate new ideas and thought processes
- Allow users to easily recall information
- Help users take notes and plan tasks
- Make it easy to organize ideas and concepts
How to Mind Map in 3 steps
- All mind maps begin with a main concept or idea that the rest of the map revolves around, so choosing that idea or topic is the first step. Begin by creating an image or writing a word that represents that first main idea.
- From that main idea, create branches (as many as needed), that each represent a single word relating to the main topic. It’s helpful to use different colors and images to differentiate the branches and sub-topics.
- Then, create sub-branches stemming from the main branches to further expand on ideas and concepts. This helps develop and elaborate on the overall theme of the mind map. Including images and sketches can also be helpful in brainstorming and creating the sub-branch topics.
Mind maps can be created on paper but are more easily and fluidly created on a computer with mind mapping software such as Inspiration.
Mind Maps in Education and Teaching with Mind Maps
Mind mapping is a beneficial learning tool to help students brainstorm any topic and think creatively. Mind maps are particularly helpful in the writing process and provide students with a natural way of thinking and building thoughts on a story plot or theme.
Mind maps also provide teachers with insight into their students’ thought process regarding a specific topic. By asking students to create mind maps demonstrating their comprehension of a concept, teachers are able to understand what a student’s prior knowledge was and how well the student understands the assignment or the material being taught. This is a very effective way of evaluating students’ understanding.
Mind mapping can also be used for planning and organising. Click to find out how this SEN Advisor uses Inspiration 10 to help students with autism to plan.
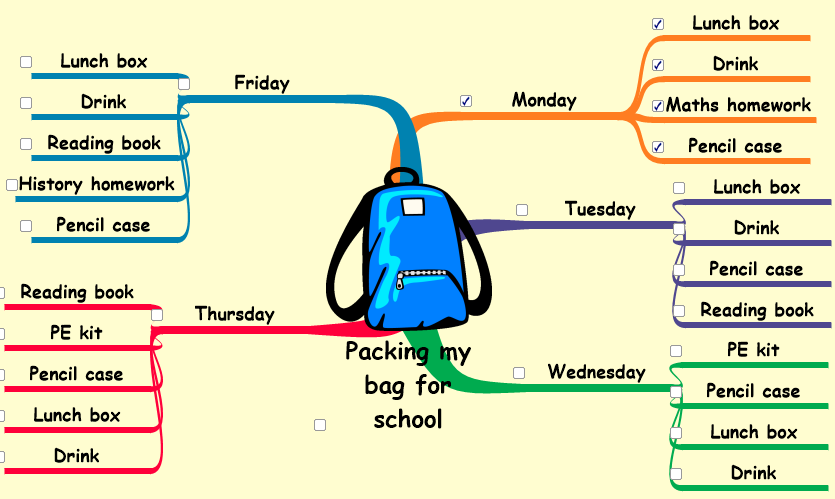
Example mind map for packing a school bag, created in Inspiration 10
Outlining with Inspiration 10
Introduction to Outlining
If you don’t understand the benefits of outlining you may be inclined to skip the prewriting process, thinking it will save time. For most, this backfires. You may get mid-way through an assignment and wonder, “what else do I have to say?”, “what was my main point?” and “why doesn’t my essay make sense?”
Outlining answers these questions before you invest time in writing an essay or report. Dennis G. Jerz, an associate professor of English at Steton Hill University, Greensburg, PA, makes a great comparison of two students who begin writing with and without outlines in his blog post titled, Outlines: How They Can Improve Your Writing. He says that outlines can help students write “better work, in less time”, arguing that there’s little to lose by creating an outline. You can jump around with ideas, make multiple attempts, backtrack and explore the essay without investing too much time in a final project.
Outlining is a great strategy for:
- Writing essays and reports
- Note taking
- Creating business plans
- Producing legal documents
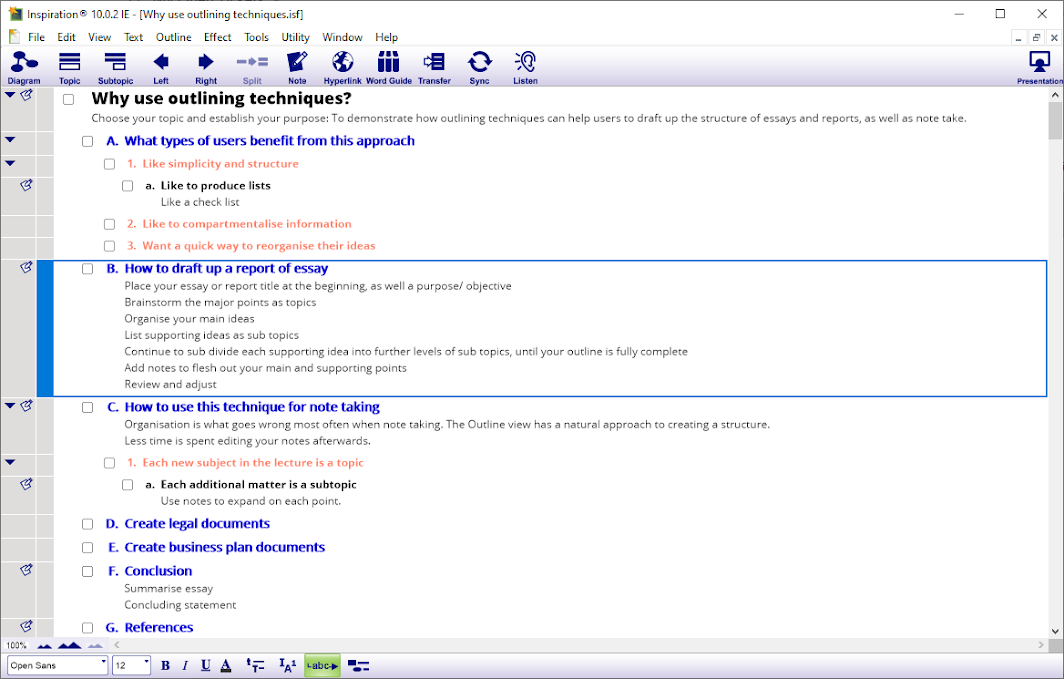
Outlining example: Why use outlining techniques?
Definition of an Outline
An outline is a preliminary summary of written work, typically hierarchically organized in headings and subheadings.
Benefits of Outlining
Used to organize one’s thoughts and information related to a project, outlining helps users clarify their ideas. Structuring and organizing large volumes of information and research in a traditional outline is the first step in the writing process. Additionally, outlines help demonstrate the thinking process behind an essay or report which can help show a teacher where a student may need help or further instruction.
How to Outline
Used as the first step in the writing process, outlining is the best way to organize notes and large amounts of information. Outlines help users build notes, essays and reports in a structured way.
Before diving into writing a paper, create an outline:
- Begin with a main idea or thesis, which is a short summary of the central idea.
- Divide and subdivide topics using prefix labels, giving you a basic overview of broad ideas and concepts.
- Support those ideas with more specific examples or supporting facts.
- An outline can be fine-tuned by editing, rearranging and changing priorities of topics and subtopics.
Using essay outline templates or graphic organizer templates, like those found in Inspiration 10, helps users begin the writing process, visualize how to outline and understand how helpful outlining can be.
Outlining in the Classroom
By categorizing bits of information, students can begin compiling notes to build and organize essays. As they place notes into categories they can easily find pieces of information that don’t fit with the overall theme of their subject and edit accordingly. We encourage teachers to emphasize the importance of pre-writing steps such as brainstorming and outlining, in order to help students write more cohesive and complete essays.
Tools to Help With Outlining
Inspiration has a powerful, but easy-to-use outlining tool built into the software. This outlining tool makes it easy for users to arrange and rearrange their notes in a way that makes the most sense to them.
However, we recognize that not all users learn in the same way, so may not find traditional outlining easy. For many visual learners, starting with a concept map, mind map or idea map feels more natural and makes the process more manageable. Inspiration’s Outline View is integrated with the Diagram/ Mind Map View, meaning users can visually develop and organize information in the Diagram/ Mind Map View, before transforming their visual maps into structured outlines with one click to begin the writing process with ease.
From Diagram View to…
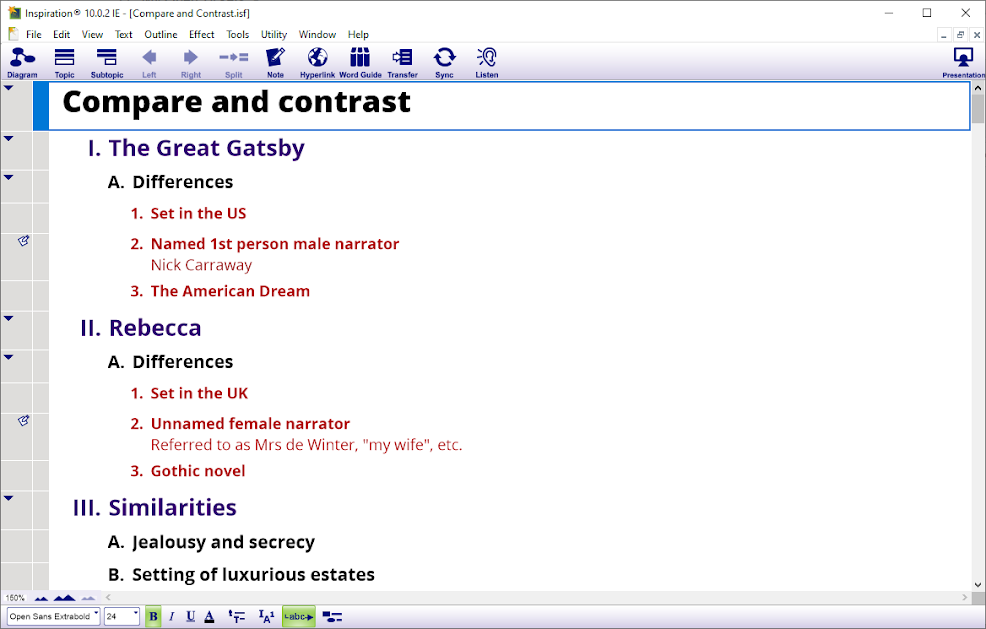
Outline View in one click! Ready to begin writing.
Graphic Organizers: Definitions and Uses
Introduction to Graphic Organizers
Graphic organizers are varied in form and use, appearing as flow charts, webs, Venn diagrams, compare and contrast diagrams, and more. As such, they can deal with a single, or multiple main ideas and can illustrate the various connections and relationships between these ideas.
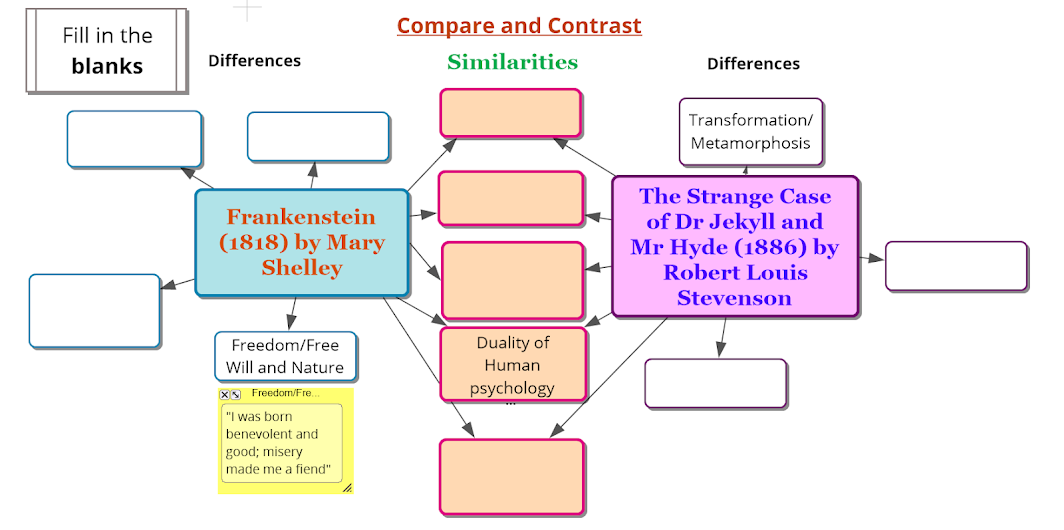
Typically, these are used as a teaching resource that engage students in analysing the relationships between concepts or ideas: a semi-complete diagram is produced by teachers in order for students to fill in blank sections. This exercise tests and develops the user’s knowledge on a particular subject, by encouraging them to classify groups of information surrounding a main idea or multiple main ideas. Graphic organizers demonstrate analytical thinking for users to internalise and use as a lifelong skill.
Definition of a Graphic Organizer
A graphic organizer is a visual display that demonstrates relationships between facts, concepts or ideas. It specifically guides the user’s thinking as they build up and fill in the graphic organizer.
Benefits of Graphic Organizers
- Helps students to classify ideas and examine relationships
- Improves students’ reading comprehension by making information digestible
- Understand how processes work by systematically showing cause and affect
A Quick Guide on Types of Graphic Organizers
Graphic organizers have a variety of uses in a range of different subjects and disciplines. They can be used to develop a student’s knowledge on ideas, topics or processes. Accordingly, they will appear in whatever form best suits the goal of the task to be carried out. Here are some graphic organiser examples:

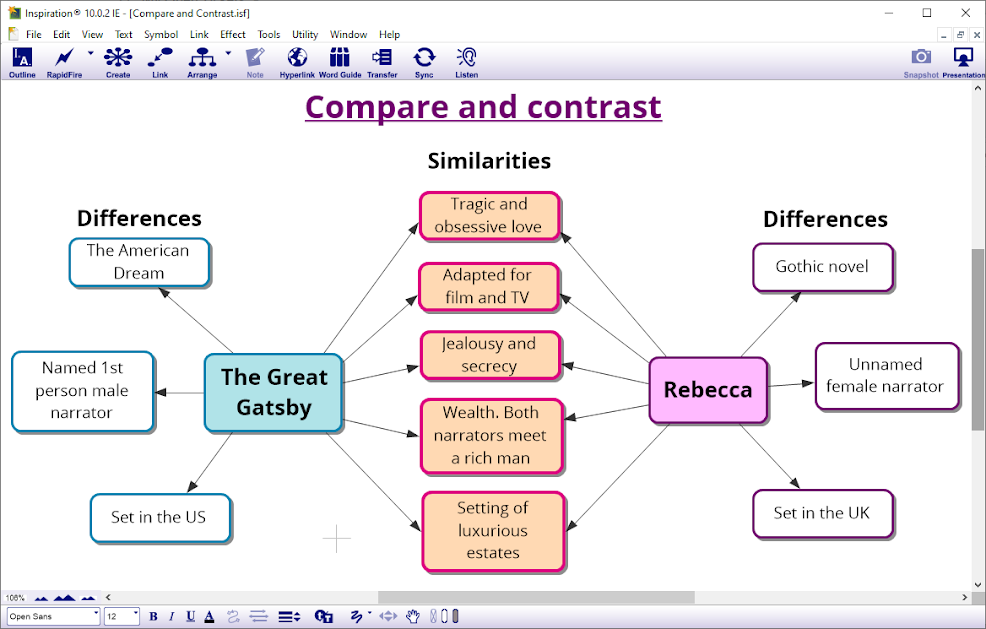
Compare and Contrast:
Compare and contrast diagrams encourage students to analytically compare two topics or subjects.
For example, if an English lesson was based on a comparison between two novels using a graphic organiser, it could appear as a semi-filled out compare and contrast diagram (see opposite). Other literary scenarios might include webs (see below) for characters or themes, or flow charts for plot.
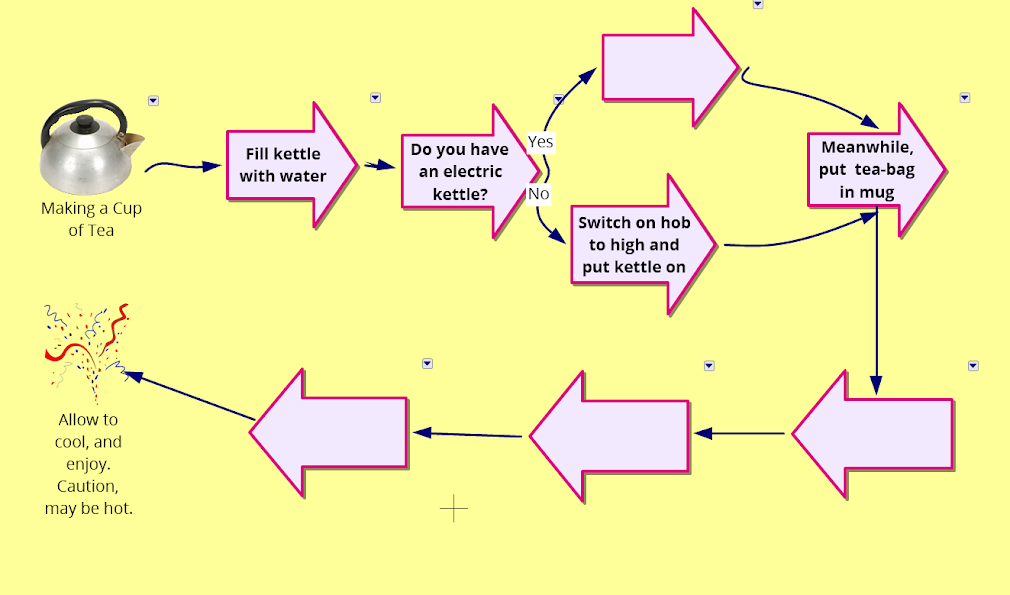
Flow Chart:
A flow chart allows students to understand the cause and effect of each stage in a process. Commonly used in a scientific scenario, exercises might include mapping out the stages of Fractional Distillation, as crude oil is turned into different products at each stage. Other flow charts may include the Water Cycle, or a Lifecycle.
Flow charts are also useful to provide instructions on an overall tasks, as members of a team can visualise where their task fits in. More simply, they can be used for everyday tasks such as making a cup of tea (see opposite).
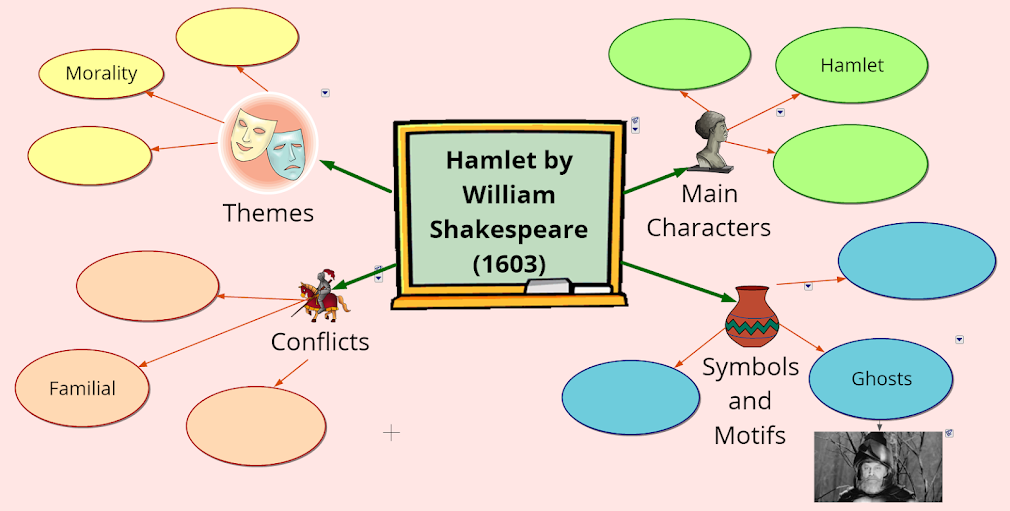 Web:
Web:
Webbing is a diagram tool that groups categories of information into associated themes, typically developed from a template for educational purposes.
For example, a web may divide the complex literary components of a play into sections to allow for easier close-analysis (see opposite). By completing the blanks in these sections, such as the themes in Shakespeare’s Hamlet, students can better their understanding of the complexities of a literary work.
Click to learn more about webbing.
Building a Graphic Organizer For the Classroom:
- Start with a main idea, topic, or concept – this will be the subject of the activity, specifically the idea or process that students need to gain an understanding of.
- Determine which type of graphic organizer to use – this is dependent on the learning goal of the activity. For example, if the subject is the fractional distillation of crude oil, the goal would be to recall the products of each sequential stage of distillation, because it is a process. A flow chart would therefore be the best graphic organizer to use.
- Then determine and fill in the key pieces of information – some initial pieces of information may be left in to guide the student’s thinking. Such as for the previous example, the first product would be petrol.
- Consider the focus of the exercise – the focus of the exercise will dictate which element of the graphic organizer the student will need to fill in. For example, if the focus is understanding the plot of the story, you may decide to leave parts of the plot blank, or to disconnect all the elements of the plot for the student to connect by drawing a line.
- Decide which elements to leave blank for the students to fill in, then remove – Finally, it can be useful to keep a master copy once you have created your graphic organizer to refer back to when checking and reviewing students’ answers.


Leave A Comment
You must be logged in to post a comment.